
Tracking Java Native Memory With JDK Flight Recorder
Update Dec 18: This post is discussed on Hacker News 🍊
As regular readers of this blog will now, JDK Flight Recorder (JFR) is one of my favorite tools of the Java platform. This low-overhead event recording engine built into the JVM is invaluable for observing the runtime characteristics of Java applications and identifying any potential performance issues. JFR continues to become better and better with every new release, with one recent addition being support for native memory tracking (NMT).
NMT by itself is not a new capability of the JVM: it provides you with detailed insight into the memory consumption of your application, which goes way beyond the well-known Java heap space. NMT tells you how much memory the JVM uses for class metadata, thread stacks, the JIT compiler, garbage collection, memory-mapped files, and much more (the one thing which NMT does not report, despite what the name might suggest, is any memory allocated by native libraries, for instance invoked via JNI). To learn more about NMT, I highly recommend to read the excellent post Off-Heap memory reconnaissance by Brice Dutheil.
Until recently, in order to access NMT, you’d have to use the jcmd command line tool for capturing the values of a running JVM in an ad-hoc way. Whereas since Java 20, you can record NMT data continuously with JFR, thanks to two new JFR event types added for this purpose. This makes it much easier to collect that data over a longer period of time and analyze it in a systematic way. You could also expose a live stream of NMT data to remote clients via JFR event streaming, for instance for integration with dashboards and monitoring solutions.
|
The list of JFR event types grows with every release. If you’d like to learn which event types are available in which Java version, take a look at the JFR Events list compiled by Johannes Bechberger from the Java team at SAP. It also shows you the events added in a particular version, for instance here for the new events in Java 21. |
An Example
So let’s see how NMT data is reported via JFR. Here’s a simple example program which allocates some off heap memory, once using a good old direct byte buffer, and once using the new Foreign Memory API, finalized in Java 22 with JEP 454 (it feels so nice to be able to allocate 4GB at once, something you couldn’t do before):
 1
 2
 3
 4
 5
 6
 7
 8
 9
10
11
12
13
14
15
16
17
18
19
20
21
22
23
24
import java.nio.ByteBuffer;
import java.lang.foreign.Arena;
import java.lang.foreign.MemorySegment;

import static java.time.LocalDateTime.now;

public void main() throws Exception {
  System.out.println(STR."\{ now() } Started");
  Thread.sleep(5000);

  ByteBuffer buffer = ByteBuffer.allocateDirect(1024 * 1024 * 1024);
  System.out.println(STR."\{ now() } Allocated (Direct)");
  Thread.sleep(5000);

  try (Arena arena = Arena.ofConfined()) {
    MemorySegment segment = arena.allocate(4L * 1024L * 1024L * 1024L);
    System.out.println(STR."\{ now() } Allocated (FMI)");
    Thread.sleep(5000);
  }

  buffer = null;
  System.out.println(STR."\{ now() } Deallocated");
  Thread.sleep(5000);
}
JFR records NMT events every second by default,
so I’ve sprinkled in some sleep() calls to make sure the program runs long enough and the different allocations are spread out a bit.
Just for the fun of it, I’m also using a top-level main method—as supported by JEP 463—and string templates for the log messages (JEP 459).
Let’s run this and see how those off-heap allocations are tracked by JFR.
Somewhat surprisingly, NMT in JFR is controlled via the gc setting, which must be set to a value of "normal", "detailed", "high", or "all" for recording NMT data.
This is the case for the default and profile JFR configurations which ship with the SDK,
so using either configuration will give you the NMT data.
Note though that in addition, NMT itself must be enabled using the -XX:NativeMemoryTracking JVM option:
 1
 2
 3
 4
 5
 6
 7
 8
 9
10
java --enable-preview --source 22 \
  -XX:StartFlightRecording=name=Profiling,filename=nmt-recording.jfr,settings=profile \
  -XX:NativeMemoryTracking=detail main.java
[0.316s][info][jfr,startup] Started recording 1. No limit specified, using maxsize=250MB as default.
[0.316s][info][jfr,startup]
[0.316s][info][jfr,startup] Use jcmd 47194 JFR.dump name=Profiling to copy recording data to file.
2023-12-17T18:31:00.475598 Started
2023-12-17T18:31:05.609319 Allocated (Direct)
2023-12-17T18:31:11.167484 Allocated (FMI)
2023-12-17T18:31:16.253059 Deallocated
Let’s open the recording in JDK Mission Control and see what we find. As of version 8.3, JMC doesn’t have a bespoke view for displaying NMT data, but the NMT events show up in the generic event browser view. There are two event types, the first one being "Total Native Memory Usage":
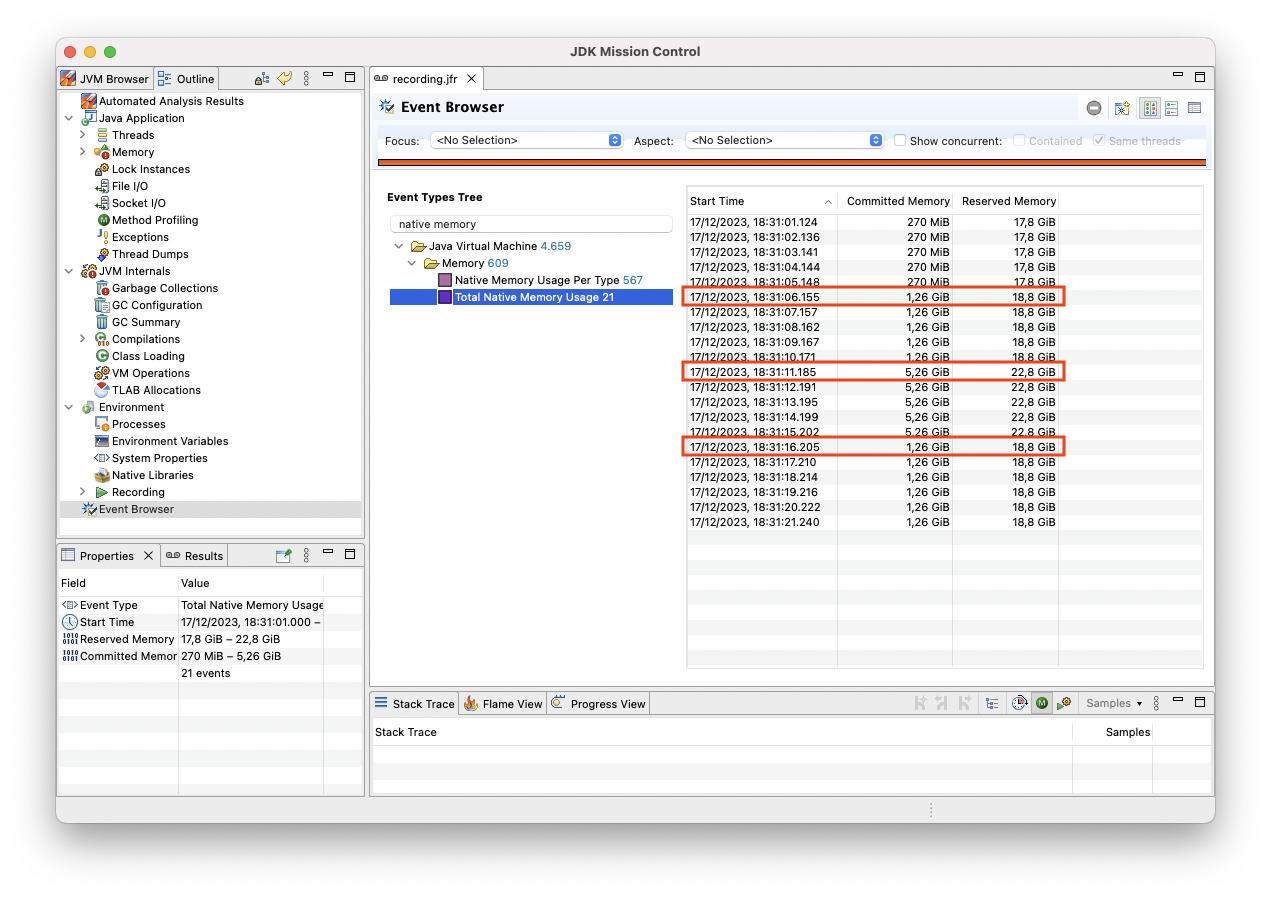
The two off-heap allocations of 1 GB (direct byte buffer) and 4 GB (Foreign Memory API) show up as expected as increases to the reserved and committed memory of the program.
We also see one of the advantages of the new Foreign Memory API:
the memory is deallocated as soon as the Arena object is closed,
whereas the JVM holds on to the memory of the byte buffer also after discarding the reference.
There’s no control over when this memory will be released exactly,
it will be done via a phantom-reference-based cleaner some time after the GC has removed the associated buffer object.
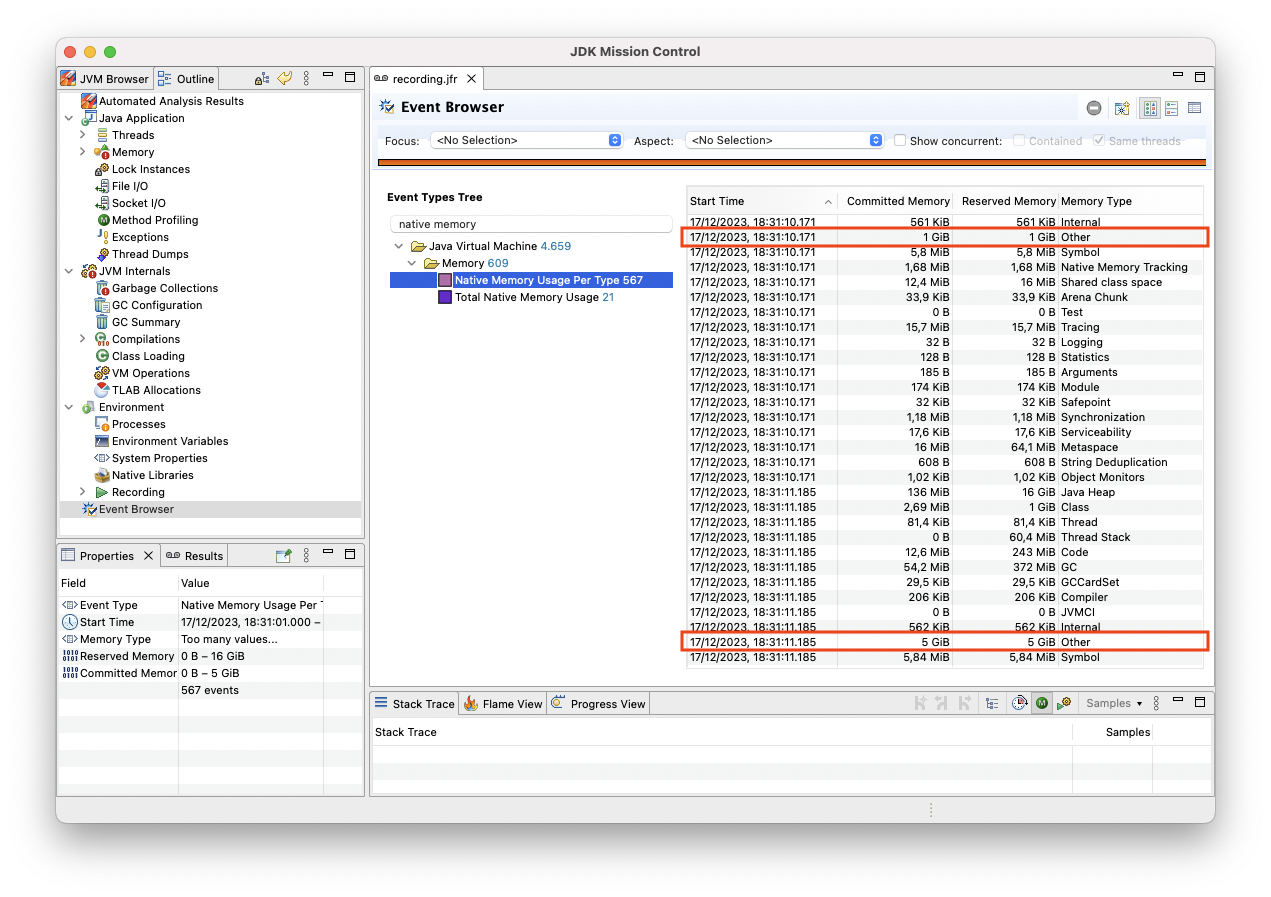
The second new event type, "Native Memory Usage Per Type", provides a more fine grained view (when setting -XX:NativeMemoryTracking to detail rather than summary).
The off-heap allocations show up under the "Other" category there:
Update Dec 18: As OpenJDK developer Eric Gahlin pointed out, you also can take a high-level view at the NMT events of a recording using the JDK’s jfr tool, which provides two built-in views for committed and reserved memory:
 1
 2
 3
 4
 5
 6
 7
 8
 9
10
11
12
13
14
15
16
17
18
19
20
21
22
23
24
25
26
27
28
29
30
31
32
33
$JAVA_HOME/bin/jfr view native-memory-committed recording.jfr

                            Native Memory Committed

Memory Type                    First Observed   Average Last Observed   Maximum
------------------------------ -------------- --------- ------------- ---------
Other                                  1,8 MB    1,7 GB        1,0 GB    5,0 GB
Java Heap                            136,0 MB  136,0 MB      136,0 MB  136,0 MB
GC                                    54,2 MB   54,2 MB       54,2 MB   54,2 MB
Metaspace                             16,0 MB   16,0 MB       16,1 MB   16,1 MB
Tracing                               15,6 MB   15,7 MB       15,7 MB   15,7 MB
Code                                  12,6 MB   12,6 MB       12,6 MB   12,6 MB
Shared class space                    12,4 MB   12,4 MB       12,4 MB   12,4 MB
Arena Chunk                            8,5 MB    2,2 MB        2,0 kB    8,5 MB
Symbol                                 5,8 MB    5,8 MB        5,8 MB    5,8 MB
Class                                  2,7 MB    2,7 MB        2,7 MB    2,7 MB
Native Memory Tracking                 1,7 MB    1,7 MB        1,7 MB    1,7 MB
Synchronization                        1,2 MB    1,2 MB        1,2 MB    1,2 MB
Internal                             563,4 kB  561,9 kB      561,7 kB  563,4 kB
Compiler                             202,9 kB  206,4 kB      205,6 kB  238,5 kB
Module                               174,1 kB  174,1 kB      174,1 kB  174,1 kB
Thread                                86,0 kB   82,5 kB       81,4 kB   86,0 kB
Safepoint                             32,0 kB   32,0 kB       32,0 kB   32,0 kB
GCCardSet                             29,5 kB   29,5 kB       29,5 kB   29,5 kB
Serviceability                        17,6 kB   17,6 kB       17,6 kB   17,6 kB
Object Monitors                        1,0 kB    1,0 kB        1,0 kB    1,0 kB
String Deduplication                608 bytes 608 bytes     608 bytes 608 bytes
Arguments                           185 bytes 185 bytes     185 bytes 185 bytes
Statistics                          128 bytes 128 bytes     128 bytes 128 bytes
Logging                              32 bytes  32 bytes      32 bytes  32 bytes
Test                                  0 bytes   0 bytes       0 bytes   0 bytes
JVMCI                                 0 bytes   0 bytes       0 bytes   0 bytes
Thread Stack                          0 bytes   0 bytes       0 bytes   0 bytes
Tracking RSS
As per the docs, NMT will cause a performance overhead of 5% - 10% (how large the overhead actually is, depends a lot on the specific workload), so it’s probably not something you’d want to do permanently in a production setting. Luckily, Java 21 adds another JFR event type, "Resident Set Size" (RSS), which allows you to track the overall memory consumption of your application on an ongoing basis:
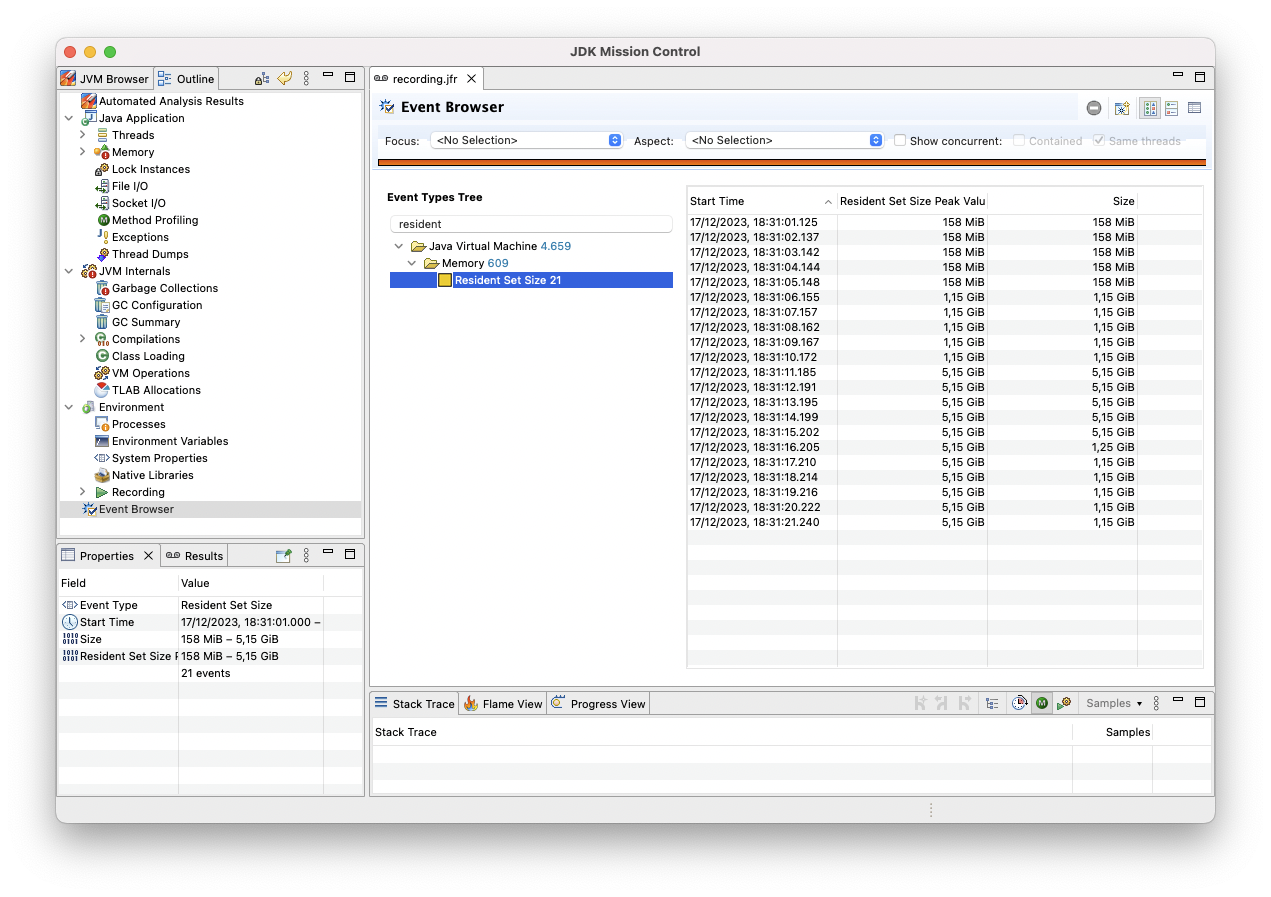
Of course you can retrieve the RSS, i.e. the physical memory allocated by a process, also using other tools like ps,
but recording it via JFR makes it really simple to analyze its development over time,
and also allows you to correlate it with other relevant JFR events, for instance for class (un-)loading or garbage collection.
With JFR event streaming, you could also expose a live feed of the value to remote monitoring clients, allowing you to keep track visually using a dashboard. But you also could apply some kind of pattern matching to this time series of values, triggering an alert when it continues to grow also after the application’s warm-up phase.
I am planning to explore how to do this with a bit of SQL using JFR Analytics in a future blog post.